
Week of –
Session recordings and heatmaps arrive
Watch visits played back, and see where people click and how far they scroll on each page. Recordings are on for every website and unlimited on every plan, and by the end of the week you could tag and group them, and download a heatmap as an image.
Analytics
Session recordings and heatmaps
Watch visits played back with session recordings: the pages someone saw, where they moved, clicked and scrolled, beside the goals and outbound clicks of the visit. Everything typed into a form is always hidden, and you can hide all text, or leave out elements and pages.
Heatmaps show where people click on each page and how far down they scroll, on desktop, tablet and mobile, with rage clicks and the most clicked elements.
- On for every website unless you switch them off, in Settings → Recordings.
- Unlimited on every plan, and neither counts toward your monthly events.
- Recordings and heatmaps are kept for 60 days.
Analytics
Open a funnel to see each step, by source, country or device
The Funnels page now lists every funnel with how many visitors entered it and its conversion. Open one for who entered and completed, the conversion, the average time to complete, and each step as a bar of everyone who entered, with how many left before the next step and what share of the step before that is.
Break an open funnel down by traffic source, channel, country, device, browser or operating system, and every figure and step follows, a payment step's revenue included. Each visitor counts toward their first visit in the period.
- A funnel can have a description, shown under its name.
- When nobody reaches a step, the funnel says which one, so you can check how it's set up.
Analytics
Revenue beside visitors in every breakdown
Each row of the dashboard's breakdowns, from channels and referrers to pages, countries and browsers, now shows its share of revenue as a grey bar right after its share of visitors, so the sources that bring buyers stand out from the ones that only bring traffic. With a goal as your #1 KPI, the bar shows that goal's completions instead.
Analytics
Retention: who came back
A new Retention page groups people by the day, week or month they first visited, or first completed a goal such as a signup, and shows how many came back in each period after: to visit again, or to complete a goal such as a purchase. A chart shows all cohorts together, and the dashboard's filters pick people by their first visit, so you can see whether visitors from search stay longer than visitors from ads.
People your website identifies with supr("identify") count as one person on every device. Anyone else is one browser, so identify signed-in users for the truest numbers.
How retention is countedAnalytics
Group recordings to see patterns
Group the Recordings list by entry page, last page, visitor, new or returning, country, device, browser, operating system, language or window width; by referrer, source, channel or UTM tag; by day of the week, time of day, length, pages viewed or clicks; or by tag. Each group shows how many recordings it has, their average length and clicks, how many had rage clicks, dead clicks or errors, and the latest. Open a group to list its recordings.
Entry and last pages show a thumbnail of the page, drawn from its heatmap snapshot; visitors show their face, countries their flag, browsers and devices their logo.
Group your recordingsAnalytics
Session recordings on for every website, unlimited
Session recordings and heatmaps are now on for every website from the start, unless its owner switches them off in Settings → Recordings. Every plan records unlimited visits: there's no monthly limit, and recordings don't count as events. Attachment storage is unlimited too.
- Recordings and heatmaps are kept for 60 days on every plan.
Analytics
A recording's details beside it
The panel beside a recording now leads with the visitor, then when the visit was, their browser, operating system and window size, its pages, length and clicks, where they were and where they came from, and the recording's tags. The player's controls sit on a bar of their own under the page.
A recording whose start never arrived (the visitor left as its first part was being sent) now says it can't be played, with its details and moments still shown, instead of an empty player.
Watch a recordingAnalytics
Colour a heatmap's clicks by who made them
A heatmap's confetti view draws every click as a dot coloured by its visitor's referrer, source, channel, new or returning, country, browser, operating system, language, window width, entry page, day, time of day or UTM tag. The busiest eight values get a colour of their own; untick one to hide its dots. On the overlay, an element's popover breaks its clicks down the same way.
How heatmaps workAnalytics
Download a heatmap as an image
Download a heatmap as a PNG of the whole page at its own size, with its clicks, scroll depth, confetti or overlay drawn over it and the average fold line, to share or keep.
How heatmaps workAnalytics
Filters list the values you have
Pick a dimension in the filter form and the values your website has seen in the last 90 days are listed under the value box, most visits first: sources, channels, campaigns, countries by name, browsers, devices and more. Type to narrow the list, or type any value of your own.
Filter your dataAnalytics
New and returning, beside the chart
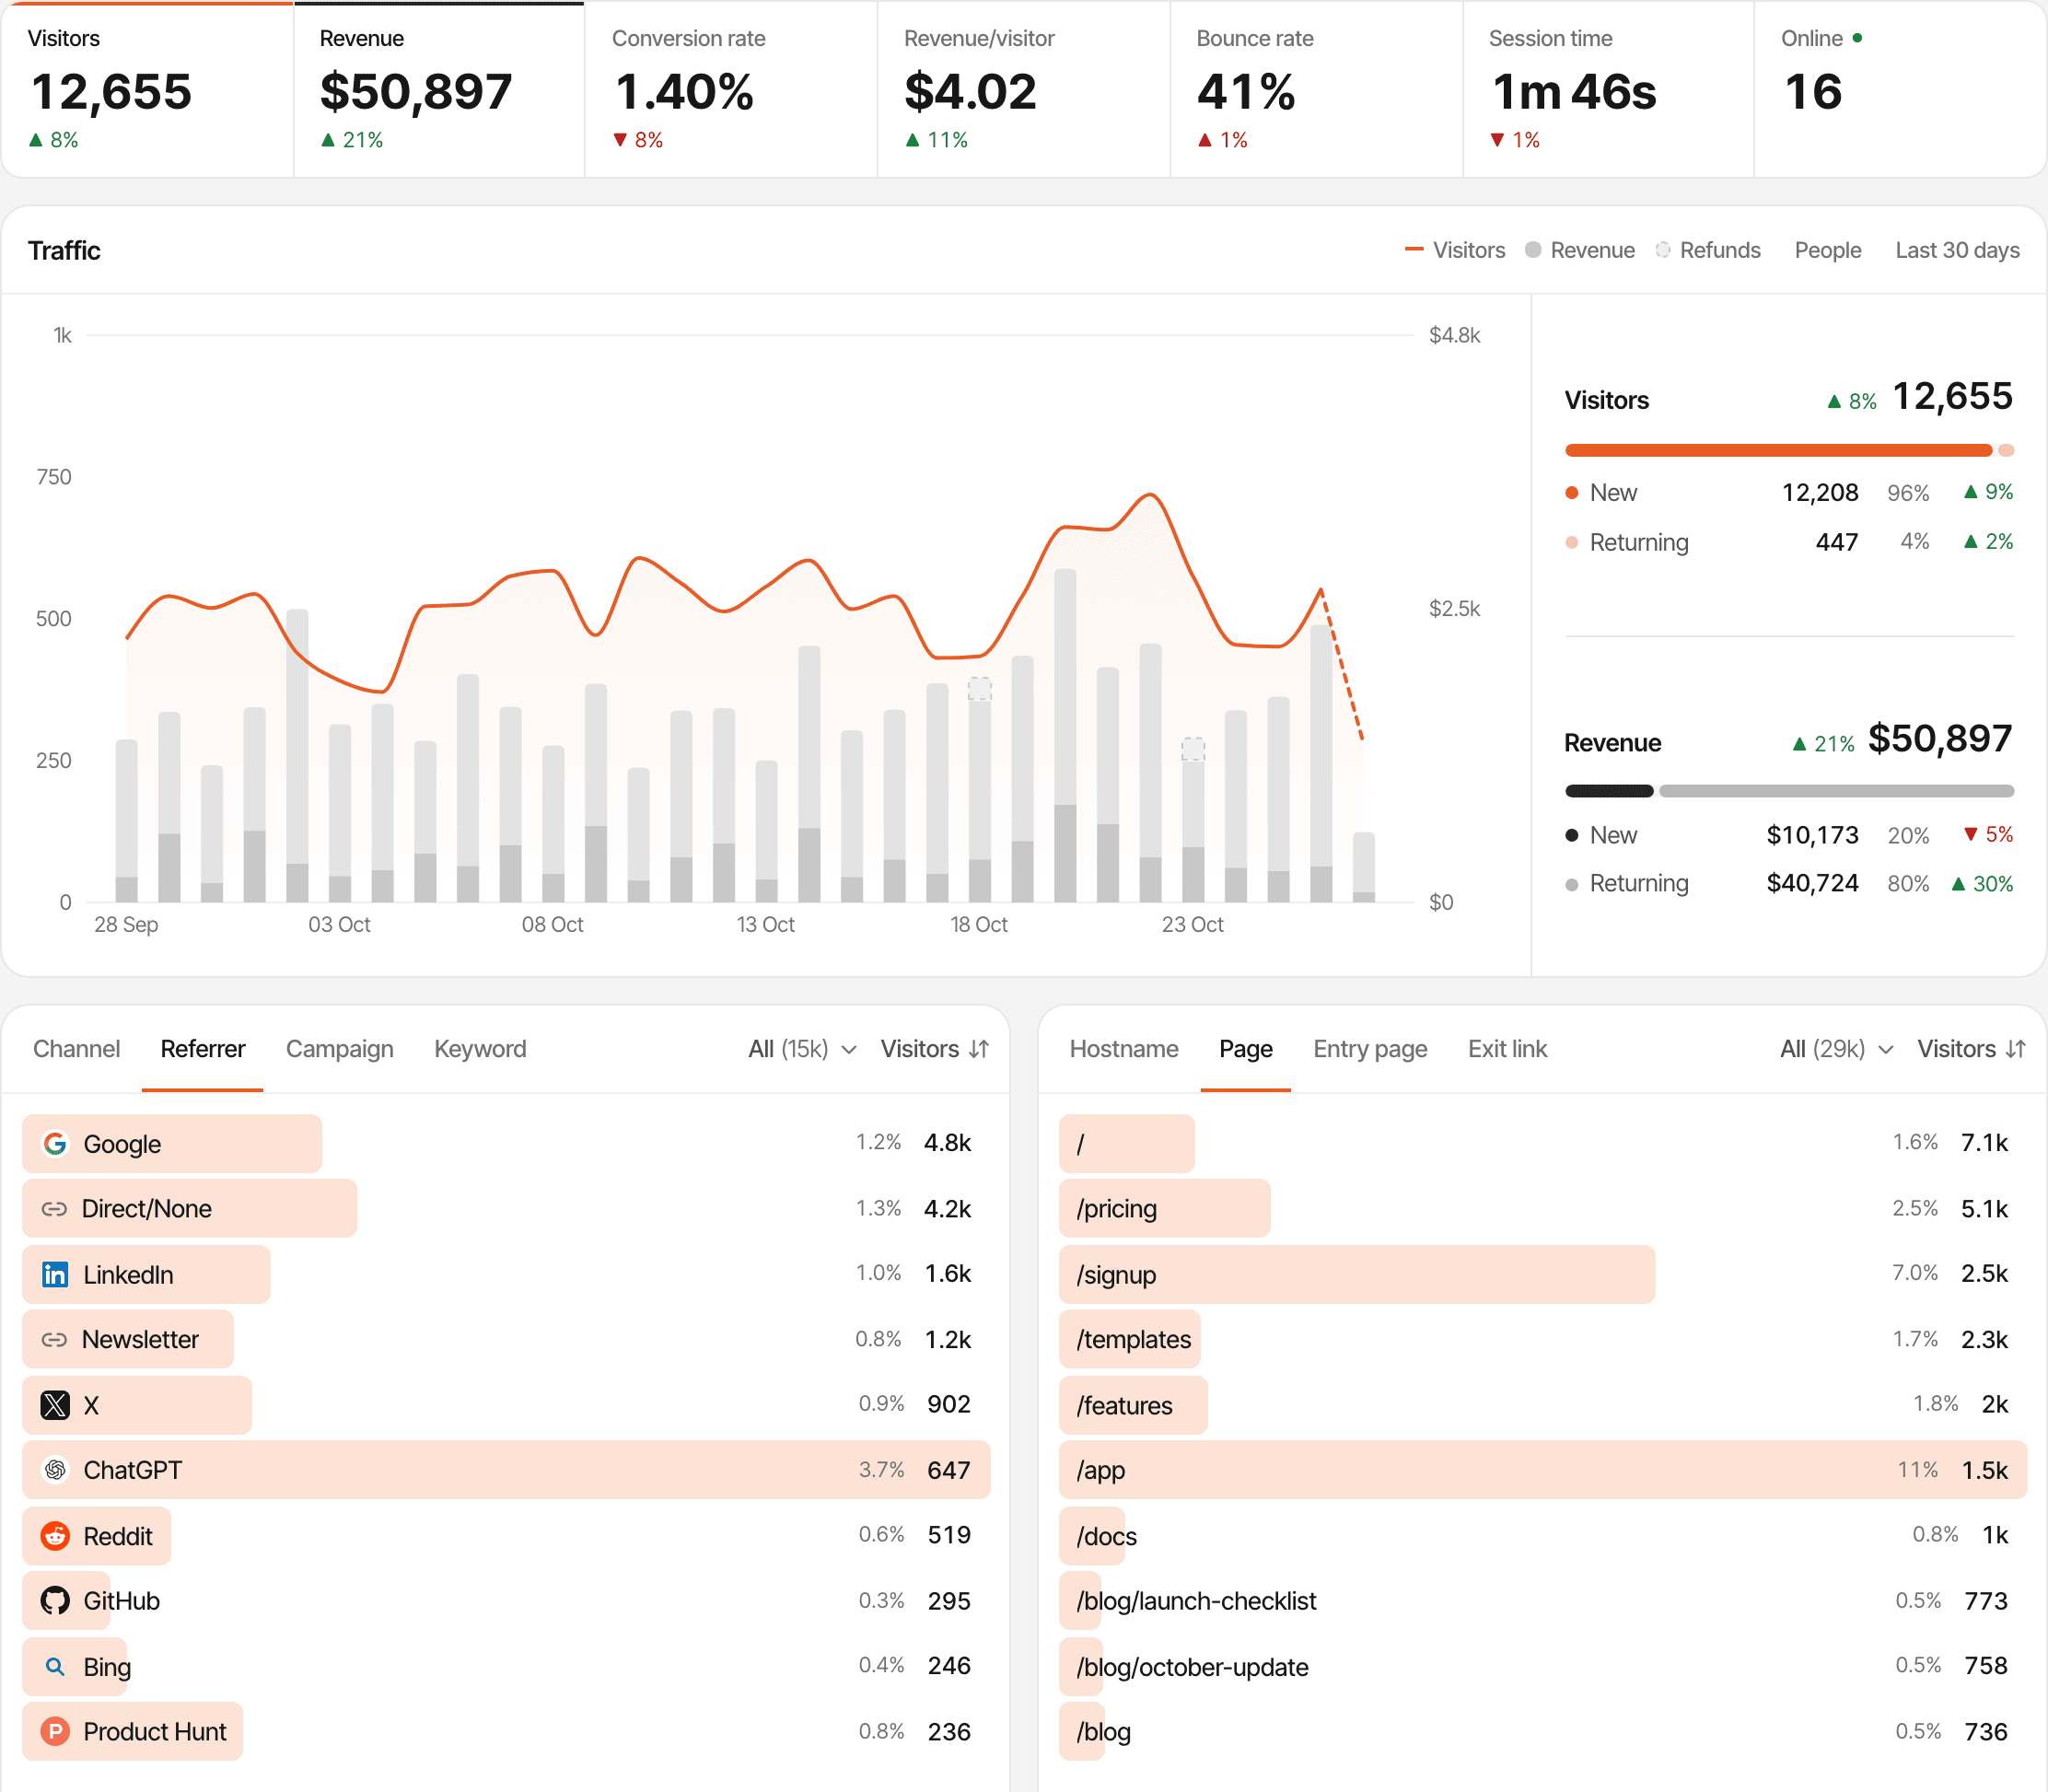
A panel beside the traffic chart splits visitors and revenue (or your #1 KPI goal) into new and returning, each with its share and its change on the period before. Payments that can't be tied to a visit get their own Unattributed row, so the totals still add up.
Revenue
Renewals and refunds on the traffic chart
Visitors are now a smooth area line, and revenue bars are stacked: new revenue at the bottom, renewals in a lighter tint above it, and refunds dashed on top. The legend reads Visitors, Revenue, Refunds and People, and each one can be switched off.
Renewals and refundsAnalytics
A simpler real-time globe
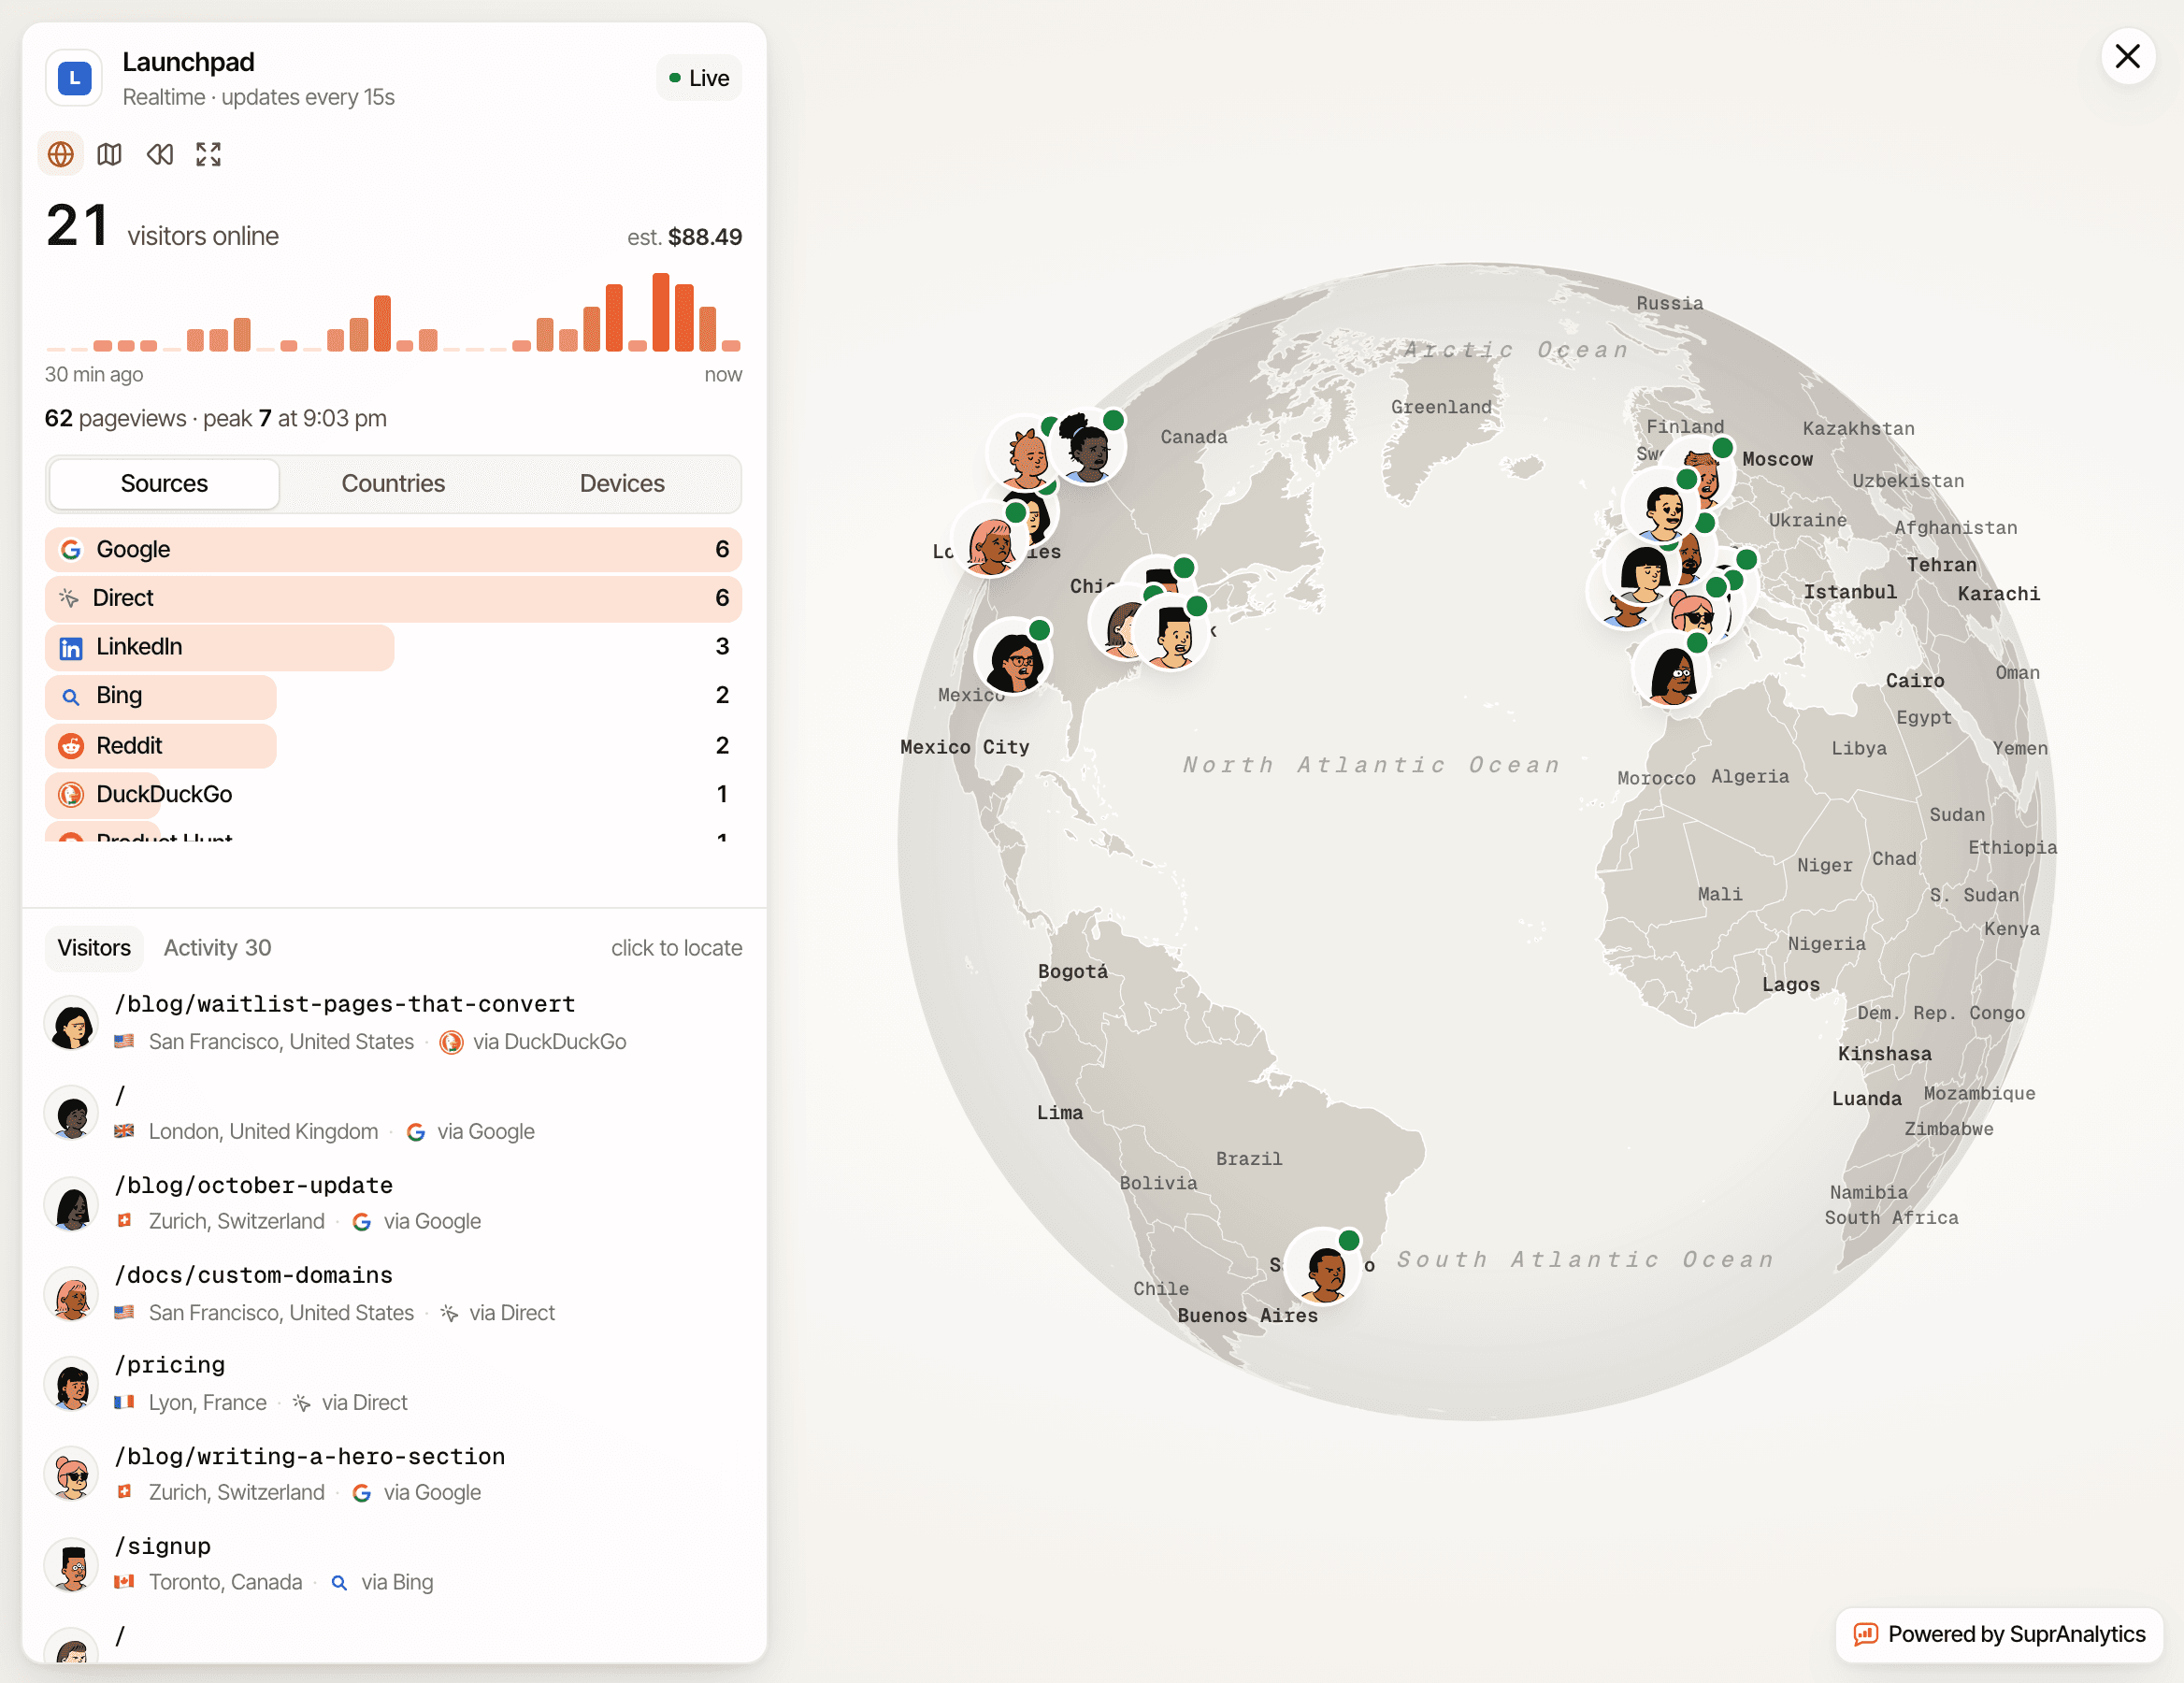
The Realtime toolbar is down to four buttons: Round globe, Flat map, Replay a day and Full screen. The globe follows the app's light or dark theme, shows visitors as avatars and turns to each new visit. Sounds moved to Settings.
Analytics
Public dashboards share totals, never customers
A public dashboard shows the same charts, goals, funnels and globe as yours, with revenue as totals. It never shows a visitor, customer or payment list, anyone's name or email, a single payment's amount, or your settings. Live places are rounded, and switching the dashboard off stops its link within seconds.
About public dashboardsPlatform
Past your events, reports pause and tracking goes on
When a paid plan goes past its monthly events, your analytics reports pause, while every event is still recorded and counted and live chat keeps working. Reports unlock as soon as you move to a plan that covers the cycle's usage, or when your next monthly renewal goes through. There are no overage charges.
Usage and limitsPlatform
Track localhost from Settings
Visits from localhost, 127.0.0.1 and .local addresses are ignored unless you ask for them. Turn on Track localhost in Settings → General, or while adding a website, to count them with no change to the snippet, and turn it off again whenever you like.
Why no data showsPlatform
Every docs page as Markdown
Each documentation page now has a Markdown copy at the same address with .md on the end, and /docs.md lists every page. Hand one to ChatGPT, Claude or your coding agent and it gets the page without the site around it.
Every page links its copy under "Read this page as Markdown". The Markdown copies stay out of search results: they point search engines to the normal page.
Open the docsPlatform
Shorter tracker attributes
The script tag and goal buttons take shorter attribute names: supr-website-id, supr-domain, supr-allowed-hostnames and supr-cookieless on the script, supr-goal and supr-scroll on your elements. Installs that use the older data-* names on the script tag keep working.
Script configurationIntegrations
Search Console by the hour for Today, Yesterday and the last 24 hours
The Search Console page used to show the last 7 days for any period shorter than a day, since Google's daily figures are about two days behind. Today, Yesterday and the last 24 hours now go by the hour, from Google's hourly data: clicks, impressions, CTR and position for those hours, a chart hour by hour in your website's timezone, and the queries and pages behind them. Google's hours can be most of a day behind, so the page says which hour they run to.
Connect Search ConsoleFixes
- Sort goals by conversions or conversion rate. The Goals page's table sorts by conversions or by conversion rate: click the column's heading, and again to flip the order.
- Usage shows your events only. The sidebar and Usage & Billing now show your events only. Attachment storage is unlimited on every plan, so it isn't metered.
- Last week, last month and last year in the date picker. The date picker has Last week (Monday to Sunday), Last month and Last year: whole calendar periods in your website's timezone, compared with the one before. Pin the ones you use to keep them at the top.
- Hourly charts on the 24-hour clock. Charts by the hour, from the dashboard to Search Console, now label their hours on the 24-hour clock (09:00, 15:00), and so do their tooltips and the notes for an hour.
- Search Console counts every click, private searches included. Google keeps searches made by only a few people private, so they count in your Search Console totals but under no query. The Queries tab now ends with a row for them, so its clicks add up to the totals, and the Pages tab counts every click a page had, private searches included.