
Filters and comparison
Filter everything in a click, and see what changed.
Click a source, a page, a country or a device and the whole dashboard narrows to those visits. Turn on Compare to see the period before under every figure and on the chart.
14-day free trial · No card required · From $9/month
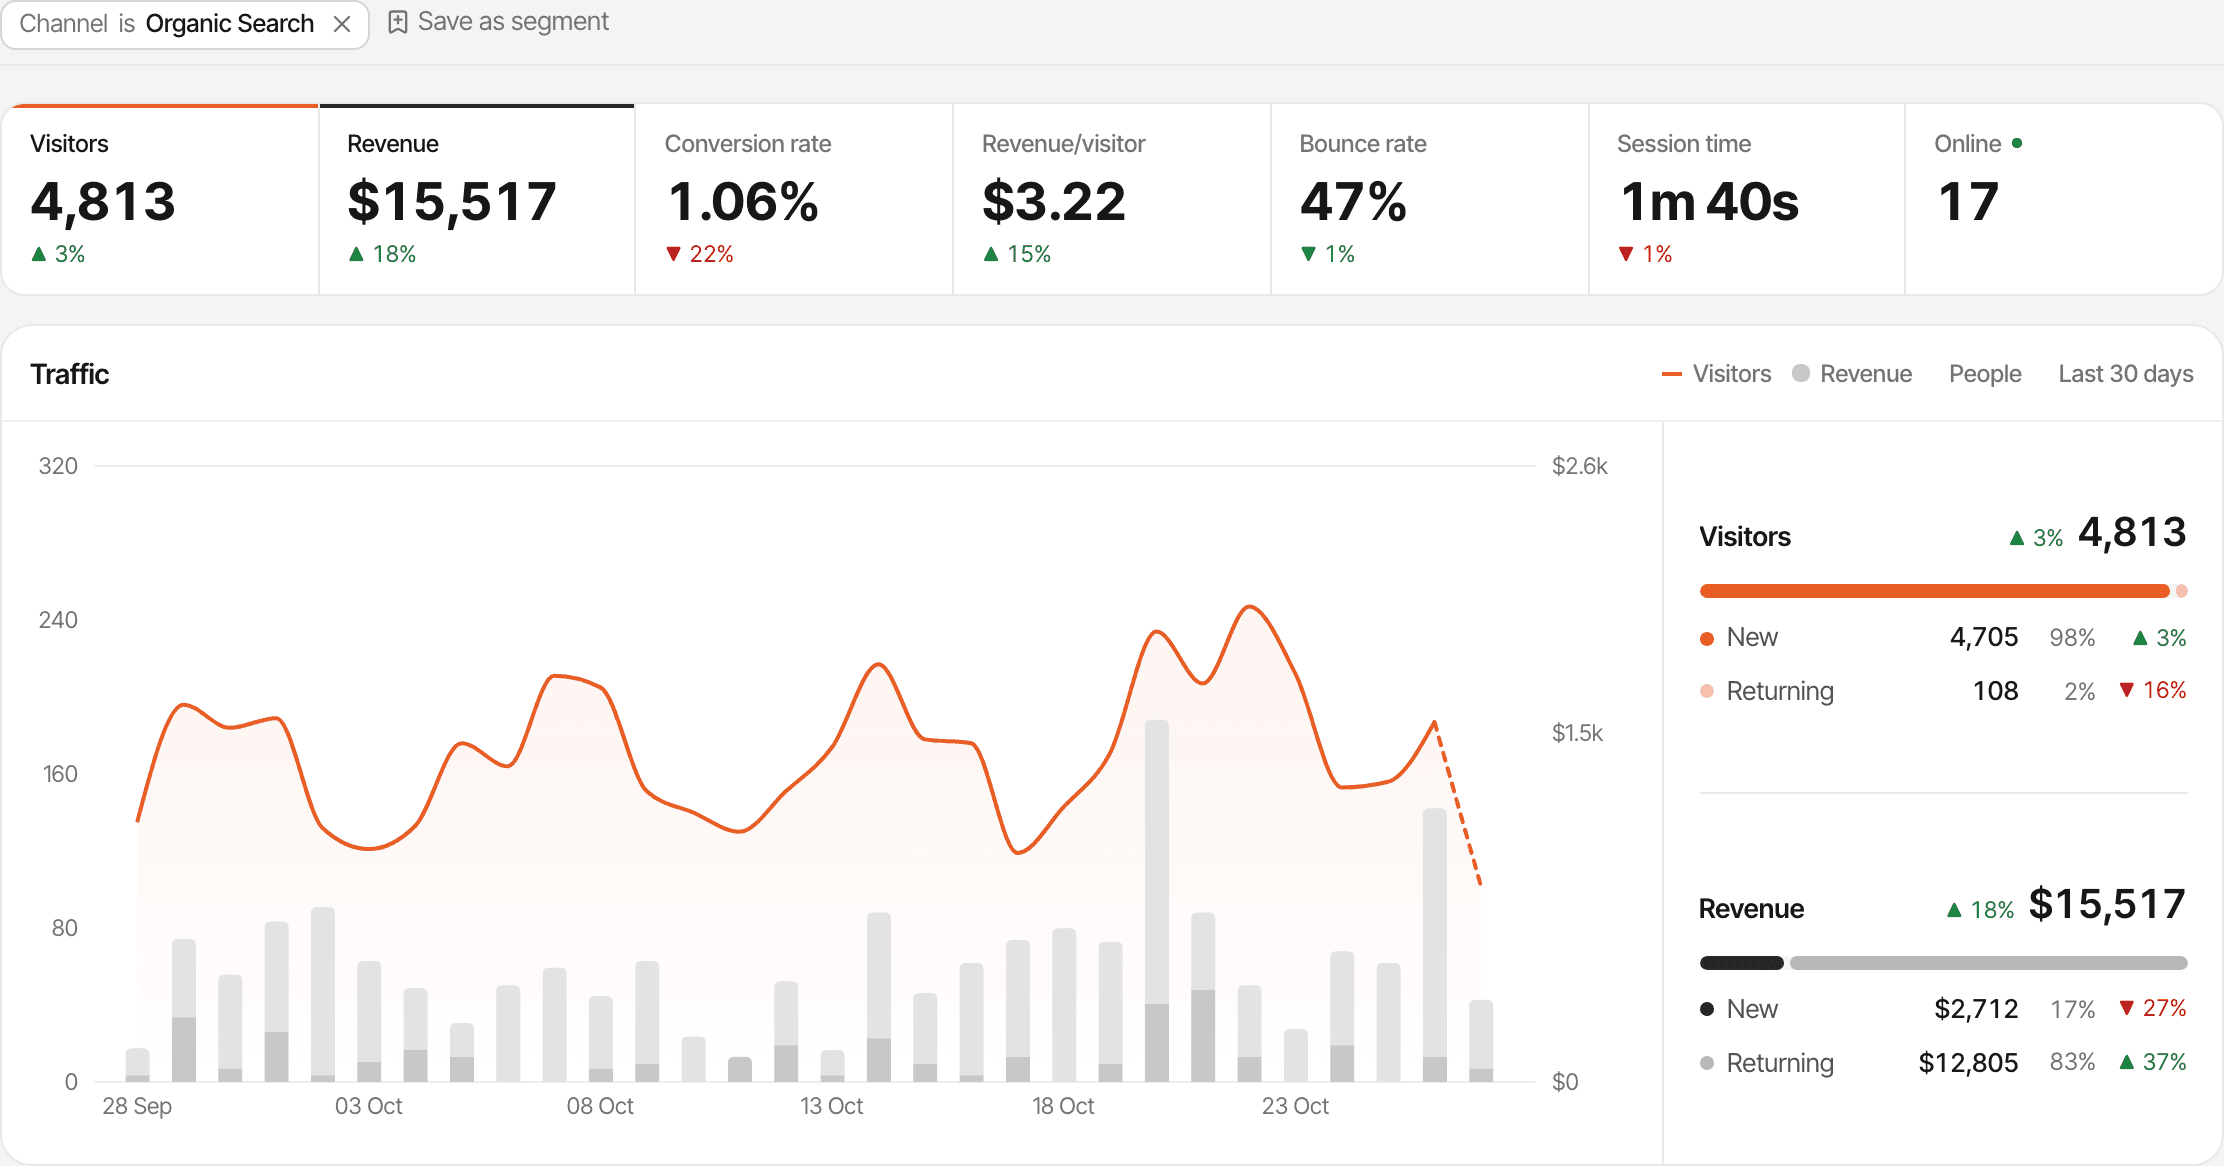
Click to filter.
Any row on the dashboard is a filter: the KPIs, the chart and every other panel follow. Filters sit in the control row; remove one with its ×, or click Clear all.
- 21 dimensions
- Channel, source, referrer, campaign and UTM tags, country, region, city, browser, OS, device, entry page, exit page, hostname, page, goal and visitor type.
- Four operators
- is, is not, contains and doesn't contain, so Page contains
/blogcovers every post. - Up to 10 at once
- A visit has to match all of them. A second filter on the same dimension replaces the first, except Page and Goal.
- Values you've seen
- The filter form lists the values your website has had in the last 90 days, most visits first. Type to narrow; countries match by name or code.
Filters that select people.
Page and Goal filters select visitors, not visits: "people who visited /pricing" or "people who signed up". Their later purchases still count, so revenue stays with the filter. Visitor type picks new or returning visitors. Keep a combination you use often as a saved segment.
Compare with the period before.
Each KPI always shows its change against the previous period of the same length. Turn on Compare to also see the previous figure under each KPI, and the previous period's visitors as a dashed line on the chart.
- Pick a period, or a custom range on the two-month calendar; ‹ and › step to the previous and next one
- Keyboard shortcuts: N now, T today, Y yesterday, D last 24 hours, W last 7 days, 3 last 30 days
- Change the chart's interval: hourly up to 31 days, daily, weekly or monthly
- Pin the periods you use most to the top of the date menu
- Click Conversion rate, Revenue/visitor, Bounce rate or Session time to chart that metric instead
- The dates and filters are in the page's address and carry over to the Pages and Goals reports
Set it up.
Click a row
Any source, page, country or device on the dashboard.
Add more
Open Filter, pick a dimension and an operator, then choose a value or type your own.
Turn on Compare
It's next to the dates, and shows which period it compares with.
How it works, in detail.
The docs page “Filter your data” goes through it step by step.
Limits worth knowing
- At most 10 filters at once, and a visit has to match all of them
- Compare is always with the previous period of the same length, not a period you pick
- The Search Console page takes the dates but not the filters
Questions, answered.
How do I filter my analytics to one traffic source?
Can I combine filters?
What does Compare compare with?
Why does revenue still show after I filter by a page?
Can I save a set of filters?
More features
- Traffic analysisVisitors, sources, pages, locations and devices, with filters and the change against the period before.Open
- Realtime analyticsWho's on your website right now, where they came from and what they're reading.Open
- UTM trackingCampaign tags read automatically, with visitors, conversions and revenue per campaign.Open
- AI trafficVisits from ChatGPT, Perplexity, Claude and other AI assistants, as their own channel.Open
- Google Search ConsoleThe Google searches that brought visitors, with clicks, impressions, CTR and position.Open
- Page analyticsThe pages people visit, where they enter, the links they leave through and every hostname.Open
- Locations and devicesCountries on a map, regions and cities, browsers, operating systems and device types.Open
- Saved segmentsKeep a combination of filters under a name and apply it in one click.Open
- New and returning visitorsTraffic split into first-time and returning visitors, on the chart.Open
- Notes on the chartPin a note at a launch or a pricing change and see it next to the traffic it moved.Open
- Session recordingsWatch visits played back, tagged with rage clicks, errors and slow pages.Open
- HeatmapsWhere people click and how far they scroll, on desktop, tablet and mobile.Open
See it on your own website.
Every feature is on every plan, with a free trial and no card.
14-day free trial · No card requiredPricingHow it worksAll features