
Page analytics
Know which pages bring people in and which ones sell.
The dashboard's Pages panel ranks your pages, entry pages, outbound links and hostnames. The Pages report lists every page viewed in the period with its views, sessions, bounce rate, time on page and revenue.
14-day free trial · No card required · From $9/month
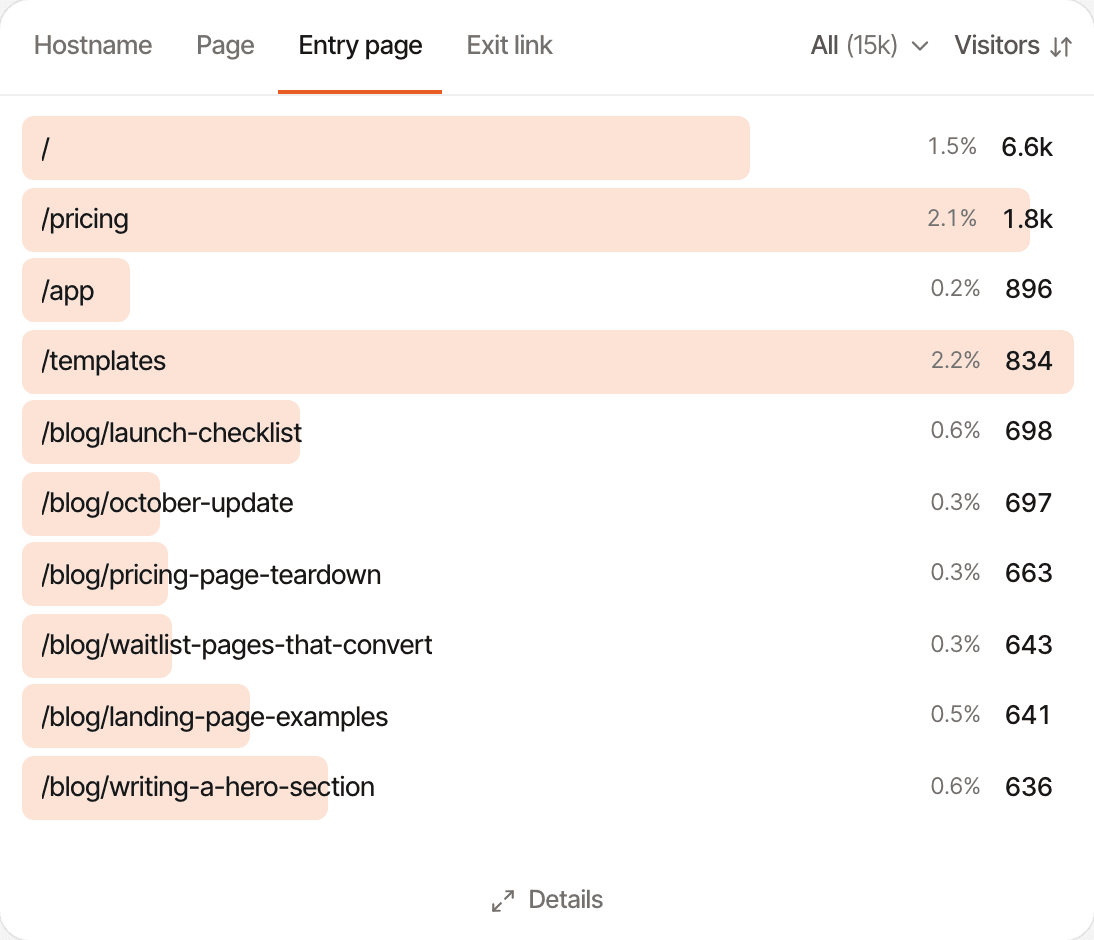
Four tabs on the dashboard.
- Page
- The pages people viewed, by visitors. Its details add pageviews, customers, conversion rate and revenue.
- Entry page
- Where visits start: the first page of each session, with bounce rate and visit duration in its details.
- Exit link
- Clicks on links to other websites, with how many visitors clicked and how many clicks. The script records them on its own.
- Hostname
- Every hostname sending data, such as example.com and app.example.com. Pick one from the menu to narrow the Page and Entry page tabs to it.
Which pages convert, not just which are busy.
Each row's bar and percentage show its share of the visitors, or of the revenue when sorted by it, scaled so the biggest row is full. Hover a row for how well it converts: the share of its visitors who paid, or completed your #1 KPI goal.
- Sort a tab by visitors or by revenue
- A page's revenue counts the payments of visitors who viewed it before paying
- Hover a row for its share of visitors and revenue; click it to filter the whole dashboard
- Details opens up to 200 rows, searchable, with sortable columns
The Pages report.
Pages in the website's sidebar is a table of every page viewed in the period, loaded as you scroll, with the dashboard's dates and filters.
- Trending
- A line of each page's views over the period, green when the second half beats the first. The table opens sorted by views gained since the previous period.
- Views and sessions
- Pageviews with their share of all of them, and sessions with the change from the previous period.
- Bounce and duration
- Bounce rate of the sessions that started on the page, and the average time spent on it.
- Revenue
- Payments from visitors who viewed the page before paying.
Show pages by path, or by URL to tell the same path apart on different hostnames. The totals at the top give pages, pageviews, sessions, average bounce and average duration.
How it works, in detail.
The docs page “How metrics are counted” goes through it step by step.
Limits worth knowing
- Exit page is a filter, not a tab; the Exit link tab lists clicks on outbound links
- Time on a page counts up to the next page viewed, and at most 30 minutes, so a tab left open doesn't inflate it
- Downloads aren't tracked on their own: add
supr-goalto a download link to count it - Outbound clicks aren't recorded when the script has
supr-outbound="false"
Questions, answered.
What is an entry page?
How is time on page measured?
Can I see revenue by page?
Are clicks on outbound links tracked?
supr-outbound="false" to the script to stop it.Can I see pages across several domains?
More features
- Traffic analysisVisitors, sources, pages, locations and devices, with filters and the change against the period before.Open
- Realtime analyticsWho's on your website right now, where they came from and what they're reading.Open
- UTM trackingCampaign tags read automatically, with visitors, conversions and revenue per campaign.Open
- AI trafficVisits from ChatGPT, Perplexity, Claude and other AI assistants, as their own channel.Open
- Google Search ConsoleThe Google searches that brought visitors, with clicks, impressions, CTR and position.Open
- Locations and devicesCountries on a map, regions and cities, browsers, operating systems and device types.Open
- Filters and comparisonFilter the whole dashboard in a click and compare with the period before.Open
- Saved segmentsKeep a combination of filters under a name and apply it in one click.Open
- New and returning visitorsTraffic split into first-time and returning visitors, on the chart.Open
- Notes on the chartPin a note at a launch or a pricing change and see it next to the traffic it moved.Open
- Session recordingsWatch visits played back, tagged with rage clicks, errors and slow pages.Open
- HeatmapsWhere people click and how far they scroll, on desktop, tablet and mobile.Open
See it on your own website.
Every feature is on every plan, with a free trial and no card.
14-day free trial · No card requiredPricingHow it worksAll features